

· 17 min read
cloudflare d1
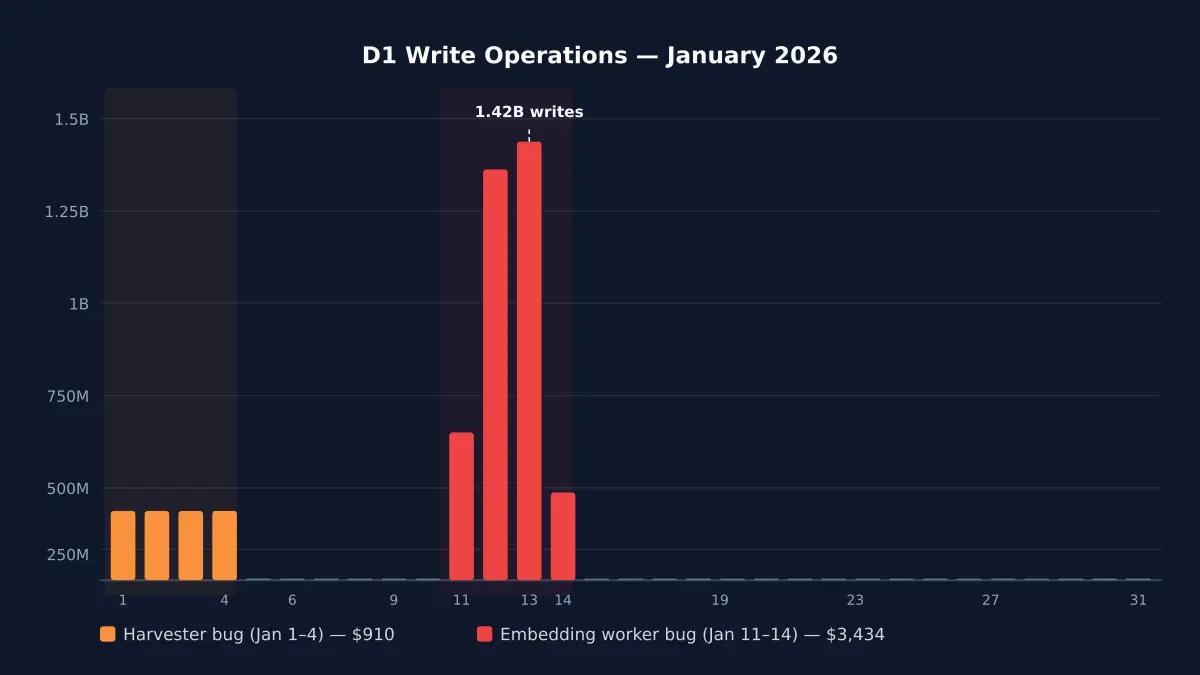
My $5/month Cloudflare bill hit $4,868 because of an infinite loop
Cloudflare D1 pricing in 2026 — what writes actually cost, where billing spirals, and how a bug turned my $5/month bill into $4,868 before I built circuit breakers.
Read more![github-actions[bot]](https://avatars.githubusercontent.com/in/15368?v=4)